[A-00098]Looker Studio(GCP)の使用方法
Google Cloudが提供するLooker Studioの使用方法を記載する。
公式ページはこちら
https://lookerstudio.google.com/navigation/reporting
・BigQueryとの連携
BigQueryのデータをレポートにする方法を記載しておく。
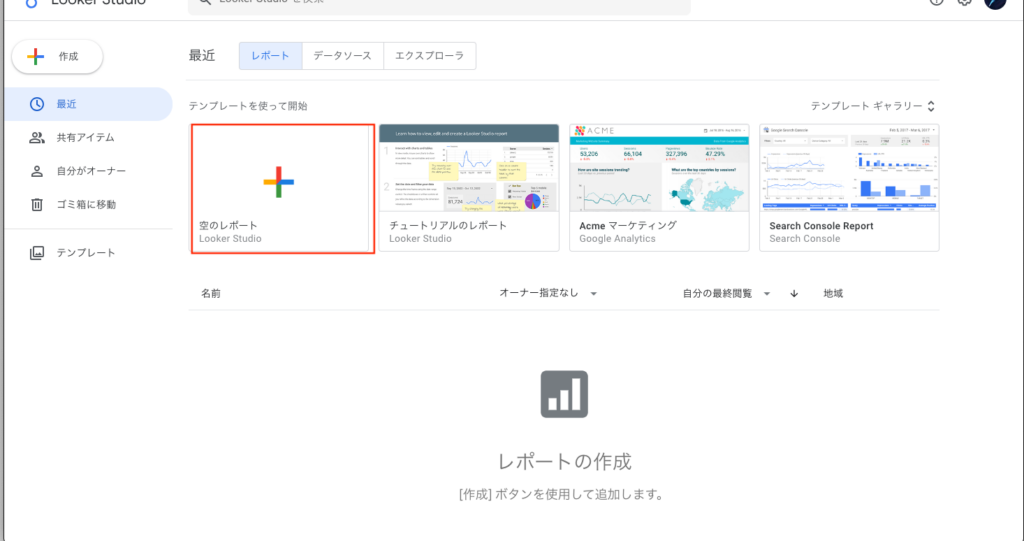
まず初めに[レポート]のアイコンを選択する。
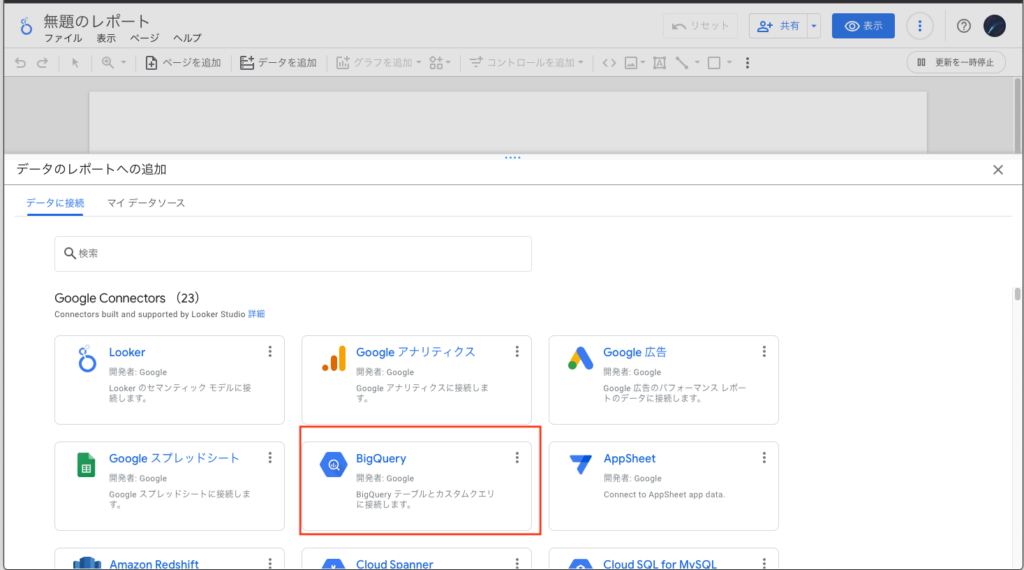
次に[BigQuery]アイコンを選択する。
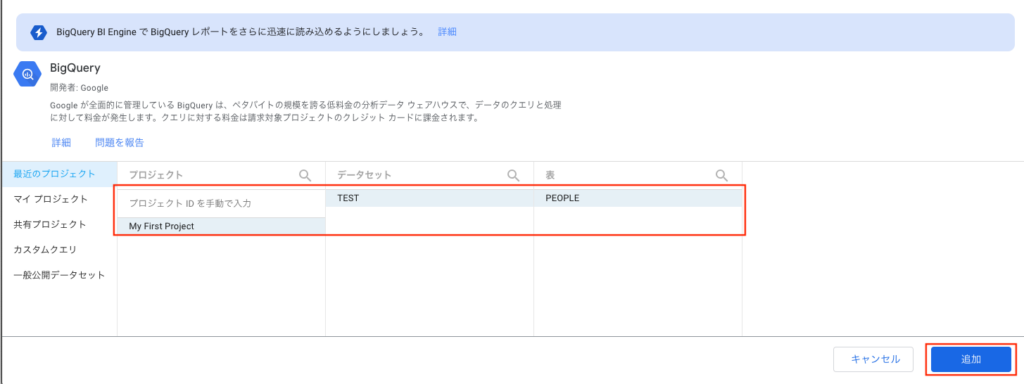
プロジェクト、データセット、テーブルを選択して[追加]ボタンを押下する。
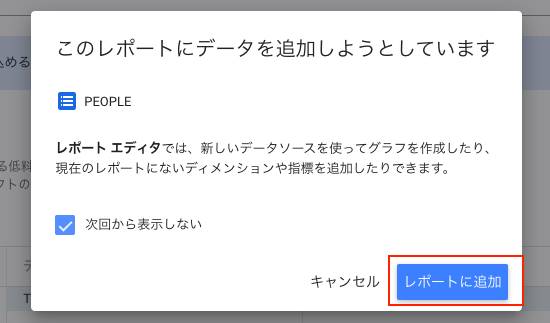
ダイアログが表示されるが赤枠のボタンを押下する。
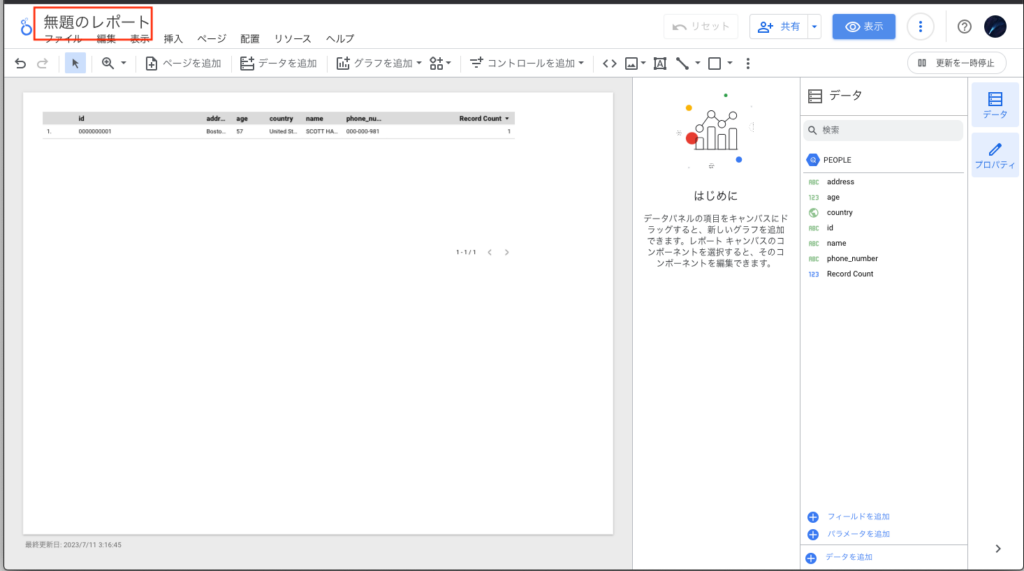
下記のようなレポート編集画面が表示される。
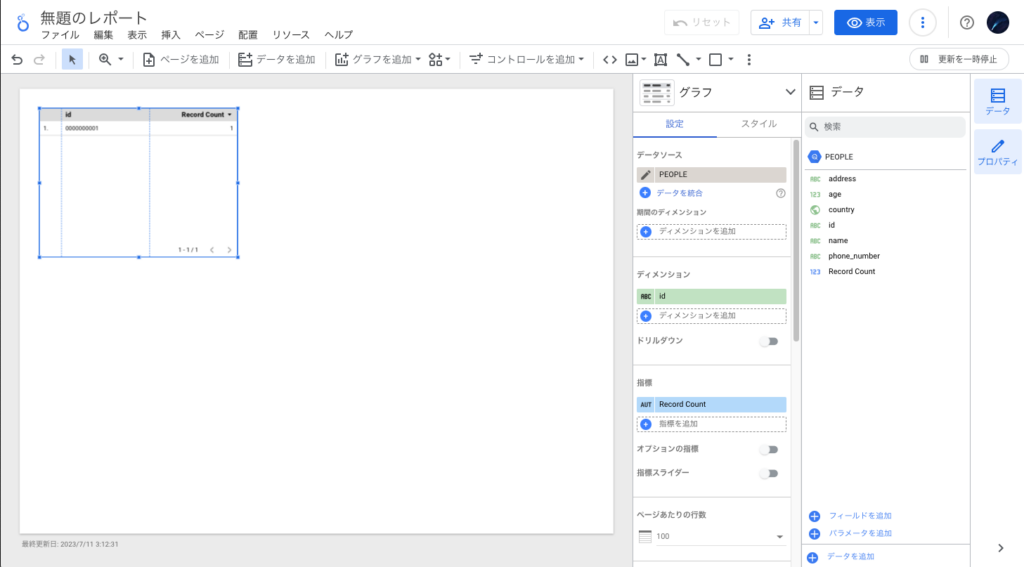
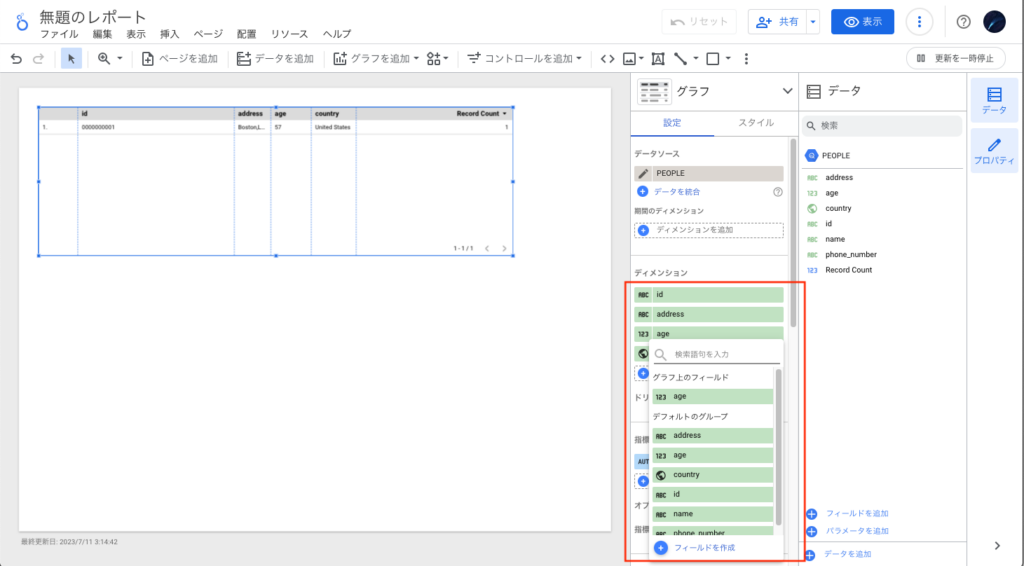
テーブルの項目全てを表示させるので、赤枠を押下して項目を選択していく。
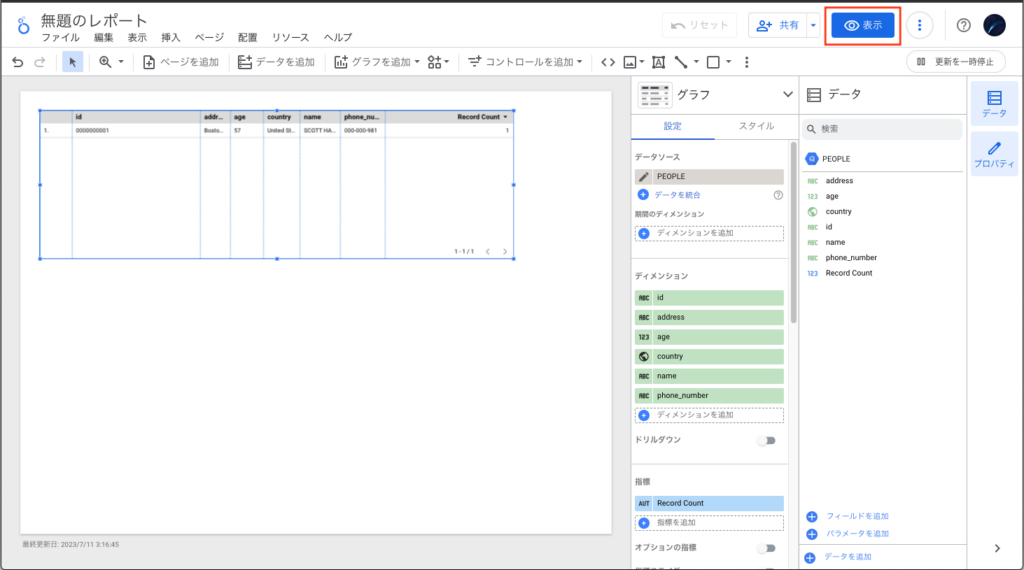
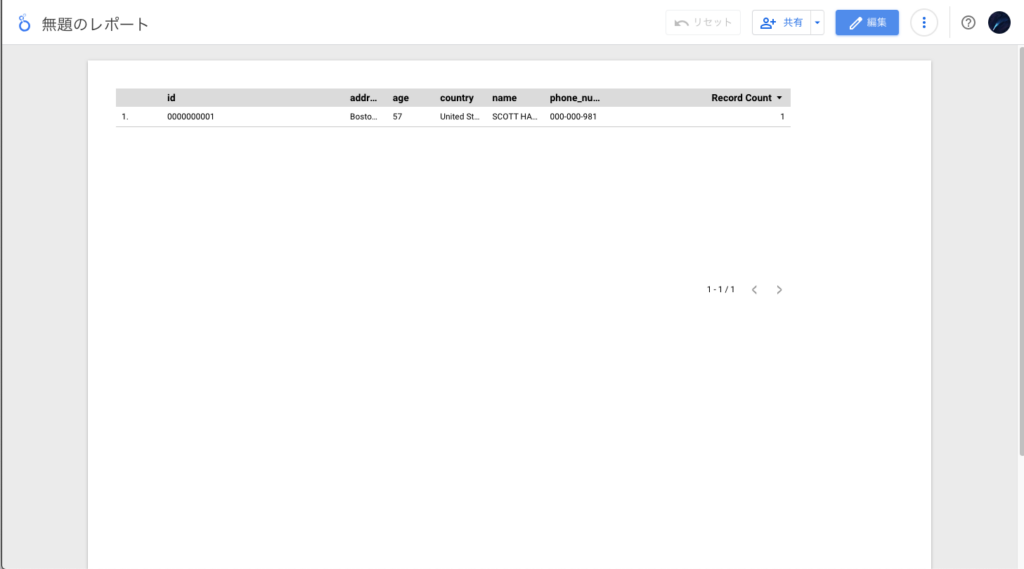
全て追加したら、右上の表示ボタンを押下してどのように表示されるか確認する。
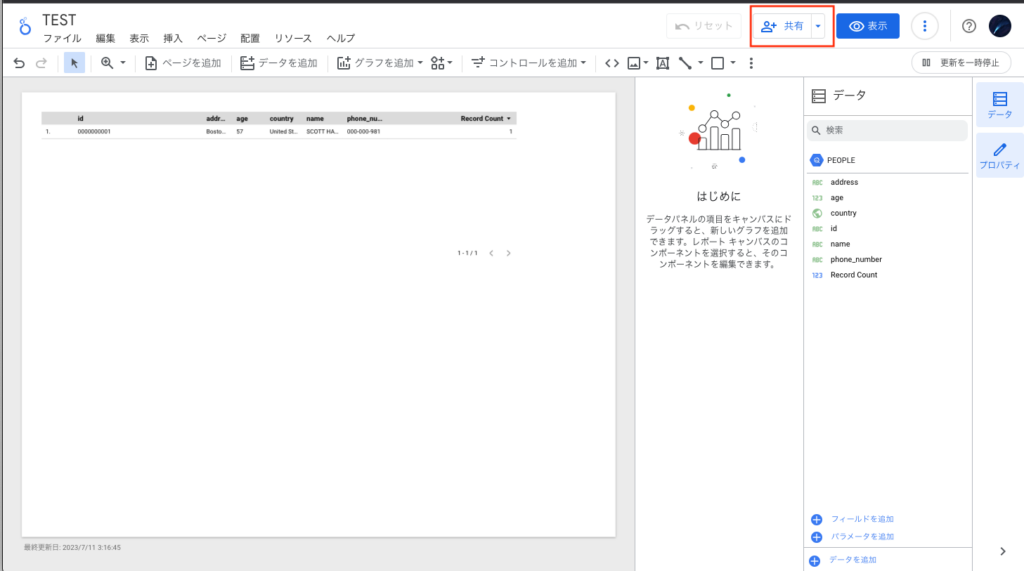
完成したら編集画面に戻り、左上のタイトルを編集する
名前をつけて右上の[共有]ボタンを押下
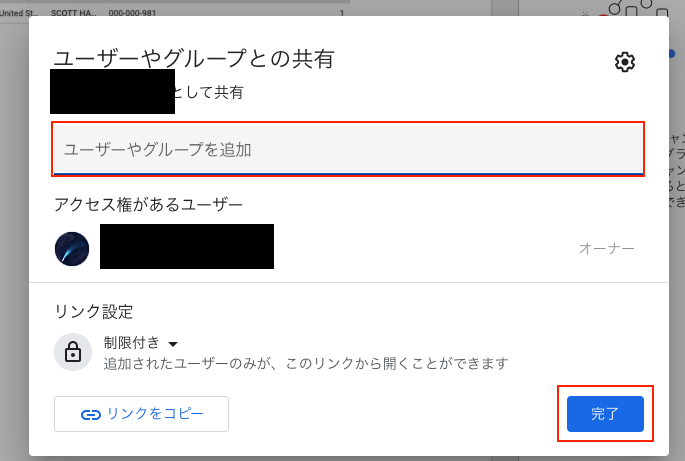
必要なユーザーを追加(見るだけなら閲覧者権限だけで良い)。
また赤枠のリンクからレポートにアクセス可能。必要ならWebサイトに埋め込みも可能。
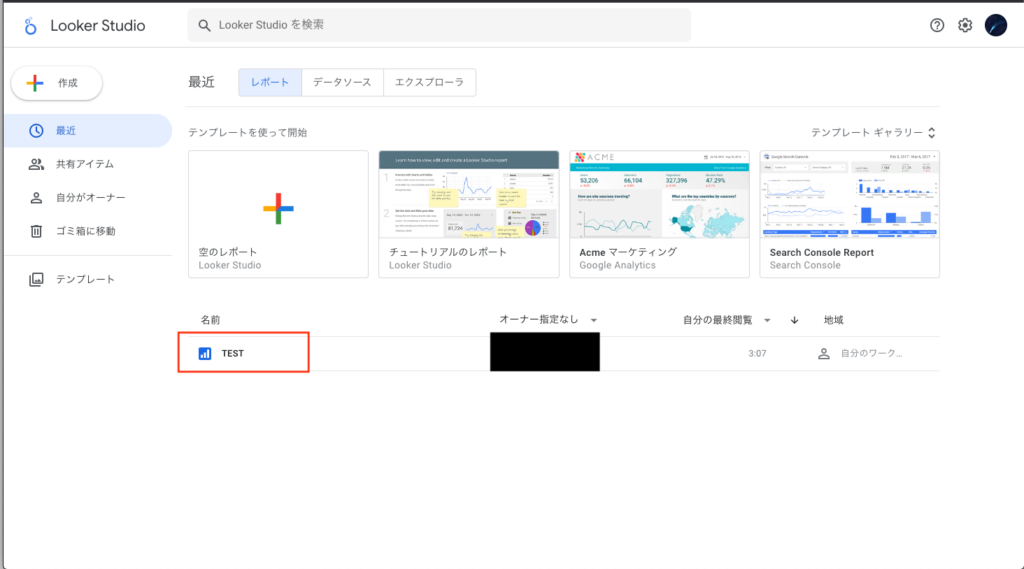
左上のLooker Studioアイコンをクリックして最初の画面に戻る
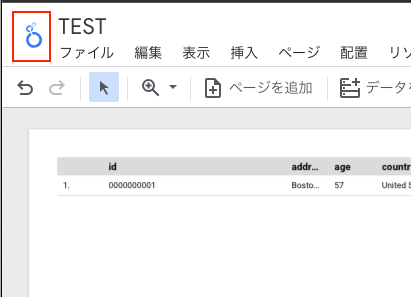
元の画面に戻ったら先ほど作成したレポートが画面下部に表示される。
・データを追加してレポートが更新される事を確認する
先ほどレポートを作成したテーブルに新たにデータを追加してみる。
INSERT INTO TEST.PEOPLE
VALUES (
'0000000002'
,'John Gartner'
,'United States'
,57
,'NewOrleans,LLC'
,'000-000-999'
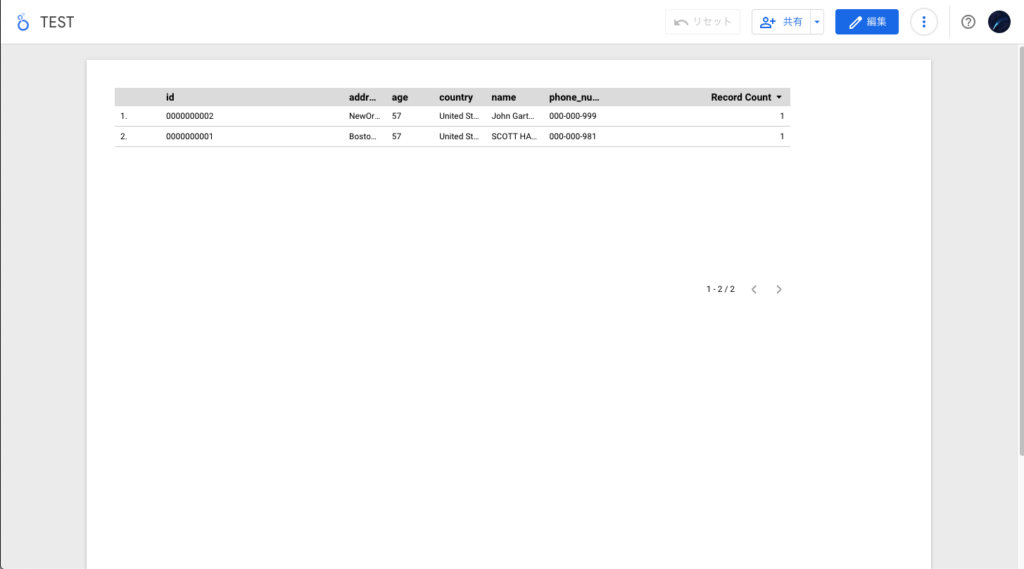
);再度Looker Studioを開いてTESTレポートを表示させる。
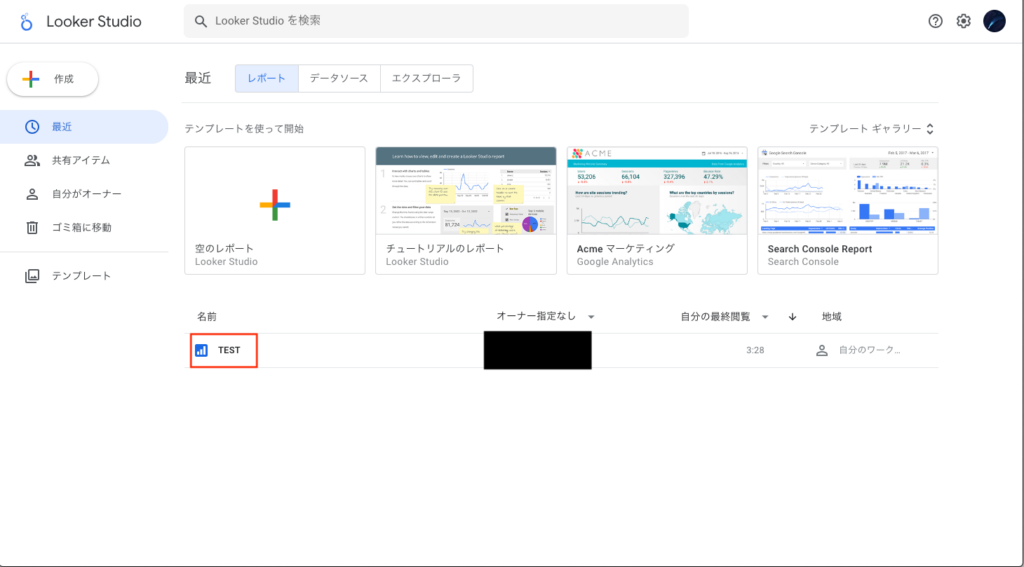
表示すると先ほどは1件しかなかったレコードが2件になっている。
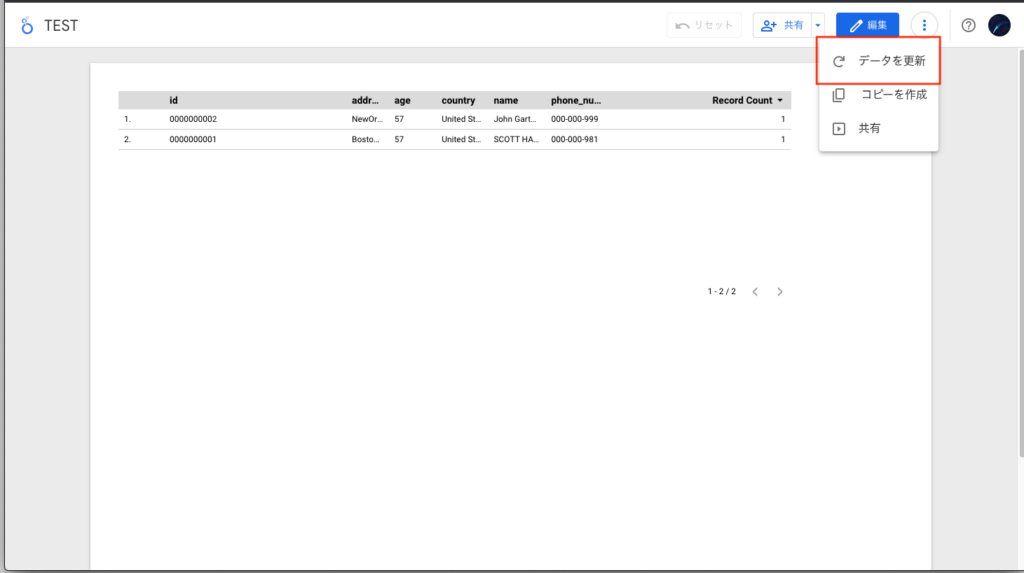
もし、テーブルの更新が反映されてない場合は右上の更新ボタンを押下する。
以上がLooker Studioの基本的な使い方です。
コメントを残す